Market Outlook
August 18, 2017
Market Cues
Domestic Indices
Chg (%)
(Pts)
(Close)
Indian markets are likely to open negative tracking global cues and SGX Nifty.
BSE Sensex
0.1
25
31,795
U.S. stocks declined amid concerns Trump’s stimulus plans are in increasing peril
Nifty
0.1
7
9,904
and amid heightened terror fears after at least 13 people died when a van plowed
Mid Cap
(0.4)
(54)
15,229
into pedestrians in Barcelona. The major averages ended the session at their worst
Small Cap
0.5
83
15,695
levels of the day. The Dow tumbled 1.2 percent to 21,751, the Nasdaq plummeted
Bankex
(0.7)
(195)
27,378
1.9 percent to 6,212 and the S&P 500 slumped 1.5 percent to 2,430.
FTSE 100 index joined global stocks and closed in red yesterday, with the premier
Global Indices
Chg (%)
(Pts)
(Close)
UK share index closing around 45 points lower at 7,388. Across Europe, the French
Cac 40 and German Dax both ended the day in the red, down 0.57% and 0.49%,
Dow Jones
(1.2)
(274)
21,751
respectively.
Nasdaq
(1.9)
(123)
6,222
FTSE
(0.6)
(45)
7,388
On the domestic turf, stocks consolidated their gains on Thursday after US Fed
Nikkei
(0.1)
(27)
19,703
minutes signalled uncertainties over near- term rate hikes. The benchmark Sensex,
which stayed up for most part of the day, hit a high of 31,937.51 on the back of
Hang Seng
(0.2)
(65)
27,344
rally in the Infosys stock following the company’s buyback proposal and unabated
Shanghai Com
0.7
22
3,268
buying by domestic institutional investors. The 30 share Sensex closed up by 0.08%,
at 31,795 while the NSE Nifty, after recapturing 9,900 ended at 9,904 up 0.07%.
Advances / Declines
BSE
NSE
News Analysis
Advances
1,402
923
Rajasthan government signs JV pact with HPCL for Barmer refinery
Declines
1,185
726
Unchanged
132
87
Draft pharma policy hints at fixing trade margins and pushing generics
Detailed analysis is on Pg2
Volumes (` Cr)
Investor’s Ready Reckoner
BSE
3,235
Key Domestic & Global Indicators
NSE
24,336
Stock Watch: Latest investment recommendations on 150+ stocks
Refer Pg7 onwards
#Net Inflows (` Cr)
Net
Mtd
Ytd
FII
(1,524)
(4,199)
54,197
Top Picks
CMP
Target
Upside
MFs
(38)
4,434
55,380
Company
Sector
Rating
(`)
(`)
(%)
Blue Star
Capital Goods
Accumulate
738
760
3.0
Top Gainers
Price (`)
Chg (%)
Dewan Housing FinanceFinancials
Buy
448
550
22.6
Aban
185
13.6
Mahindra Lifespace
Real Estate
Buy
414
522
26.2
Navkar Corporation
Others
Buy
192
265
38.3
Gmrinfra
19
13.4
KEI Industries
Capital Goods
Buy
210
258
22.7
Gsfc
137
8.4
More Top Picks on Pg5
Intellect
112
8.4
Key Upcoming Events
Beml
1,860
8.3
Previous
Consensus
Date
Region
Event Description
Reading
Expectations
Aug 23, 2017 US
Industrial Production
0.39
0.30
Top Losers
Price (`)
Chg (%)
Aug 23, 2017 Germany PMI Manufacturing
58.10
Apollohosp
1,100
(5.1)
Aug 23, 2017 UK
GDP (YoY)
1.70
Unitech
8
(4.0)
Aug 23, 2017 Euro Zone Euro-Zone Consumer Confidence
(1.70)
Ajantpharm
1,214
(3.0)
Aug 24, 2017 US
New home sales
610.00
612.50
Centralbk
72
(3.0)
More Events on Pg7
Religare
68
(2.9)
#as on 17th Aug, 2017
Market Outlook
August 18, 2017
News Analysis
Rajasthan government signs JV pact with HPCL for Barmer
refinery
The Rajasthan government has signed a JV agreement with Hindustan Petroleum
Corporation for the upcoming mega petroleum refinery in Barmer at a cost of
`43,129cr. Under this agreement, HPCL will hold 74 per cent stake in the JV,
while the state government will hold the rest 26 per cent. As a result of the re-
negotiation with HPCL, a saving of `40,000cr has been ensured in project cost.
Draft pharma policy hints at fixing trade margins and pushing
generics
The draft pharma policy has laid down several policy prescriptions including
enhancing quality standards, reign in unfair trade practices, faster approvals,
boost indigenous manufacturing, and encourage R&D. According to the draft
policy, the government will decide on the drugs to be subjected under price
control, while NPPA will be responsible for laying down the price ceilings of
selected medicines; enforcement of those price ceilings; and ensuring that the
medicines are available in the market in adequate quantities. It also indicates
government’s intention to fix the level of trade margins and bring down the prices
of drugs and also push the sale of generic medicines instead of branded generics.
Economic and Political News
Govt extends GST return filing deadline to Aug 28
Amit Shah sets Mission 350+ for 2019 LS polls
Economists expect GVA to grow higher at 6.3-6.5% in Q1FY18
Equity supply may reach an all-time high this fiscal: Credit Suisse
Corporate News
HDFC Bank, PNB cut savings rate by 50 basis points
WagonR: Maruti Suzuki is set to steer its fourth brand into 2 million club
Tata Motors continues to face leadership challenges
Market Outlook
August 18, 2017
Top Picks
Market Cap
CMP
Target
Upside
Company
Rationale
(` Cr)
(`)
(`)
(%)
Strong growth in domestic business due to its leadership
in acute therapeutic segment. Alkem expects to launch
Alkem Laboratories
21,743
1,819
2,161
18.8
more products in USA, which bodes for its international
business.
We expect the company would report strong profitability
Asian Granito
1,238
411
480
16.7
owing to better product mix, higher B2C sales and
amalgamation synergy.
Favorable outlook for the AC industry to augur well for
Cooling products business which is out pacing the
Blue Star
7,067
738
760
3.0
market growth. EMPPAC division's profitability to improve
once operating environment turns around.
With a focus on the low and medium income (LMI)
consumer segment, the company has increased its
Dewan Housing Finance
14,061
448
550
22.6
presence in tier-II & III cities where the growth
opportunity is immense.
Loan growth is likely to pick up after a sluggish FY17.
Karur Vysya Bank
8,753
145
160
10.5
Lower credit cost will help in strong bottom-line growth.
Increasing share of CASA will help in NIM improvement.
High order book execution in EPC segment, rising B2C
KEI Industries
1,636
210
258
22.7
sales and higher exports to boost the revenues and
profitability
Speedier execution and speedier sales, strong revenue
Mahindra Lifespace
2,123
414
522
26.2
visibility in short-to-long run, attractive valuations
Expected to benefit from the lower capex requirement
Music Broadcast
2,142
375
434
15.6
and 15 year long radio broadcast licensing.
Massive capacity expansion along with rail advantage at
Navkar Corporation
2,732
192
265
38.3
ICD as well CFS augurs well for the company
Strong brands and distribution network would boost
Siyaram Silk Mills
1,915
2,042
2,500
22.4
growth going ahead. Stock currently trades at an
inexpensive valuation.
Market leadership in Hindi news genre and no.
2
viewership ranking in English news genre, exit from the
TV Today Network
1,462
245
344
40.4
radio business, and anticipated growth in ad spends by
corporates to benefit the stock.
After GST, the company is expected to see higher
volumes along with improving product mix. The Gujarat
Maruti Suzuki
2,29,786
7,607
8,495
11.7
plant will also enable higher operating leverage which
will be margin accretive.
Source: Company, Angel Research
Market Outlook
August 18, 2017
Key Upcoming Events
Global economic events release calendar
Bloomberg Data
Date
Time
Country
Event Description
Unit
Period
Last Reported
Estimated
Aug 23, 2017
6:45 PMUS
Industrial Production
%
Jul
0.39
0.30
1:00 PMGermany
PMI Manufacturing
Value
Aug P
58.10
2:00 PMUK
GDP (YoY)
% Change
2Q P
1.70
7:30 PMEuro Zone
Euro-Zone Consumer Confidence
Value
Aug A
(1.70)
Aug 24, 2017
7:30 PMUS
New home sales
Thousands
Jul
610.00
612.50
7:30 PMUS
Existing home sales
Million
Jul
5.52
5.56
Aug 25, 2017
11:30 AMGermany
GDP nsa (YoY)
% Change
2Q F
0.80
Aug 29, 2017
7:30 PMUS
Consumer Confidence
S.A./ 1985=100
Aug
121.10
119.00
Aug 30, 2017
6:00 PMUS
GDP Qoq (Annualised)
% Change
2Q S
2.60
2.40
Aug 31, 2017
1:25 PMGermany
Unemployment change (000's)
Thousands
Aug
(8.00)
6:30 AMChina
PMI Manufacturing
Value
Aug
51.40
Sep 01, 2017
6:00 PMUS
Change in Nonfarm payrolls
Thousands
Aug
209.00
180.00
6:00 PMUS
Unnemployment rate
%
Aug
4.30
4.30
2:00 PMUK
PMI Manufacturing
Value
Aug
55.10
Sep 05, 2017
5:15 PMEuro Zone
ECB announces interest rates
%
Sep 7
-
Sep 07, 2017
2:30 PMEuro Zone
Euro-Zone GDP s.a. (QoQ)
% Change
2Q F
0.60
Sep 08, 2017
India
Imports YoY%
% Change
Aug
15.40
India
Exports YoY%
% Change
Aug
3.94
2:00 PMUK
Industrial Production (YoY)
% Change
Jul
0.30
China
Exports YoY%
% Change
Aug
7.20
Sep 09, 2017
7:00 AMChina
Consumer Price Index (YoY)
% Change
Aug
1.40
Sep 12, 2017
2:00 PMUK
CPI (YoY)
% Change
Aug
2.60
5:30 PMIndia
Industrial Production YoY
% Change
Jul
(0.10)
Source: Bloomberg, Angel Research
Market Outlook
August 18, 2017
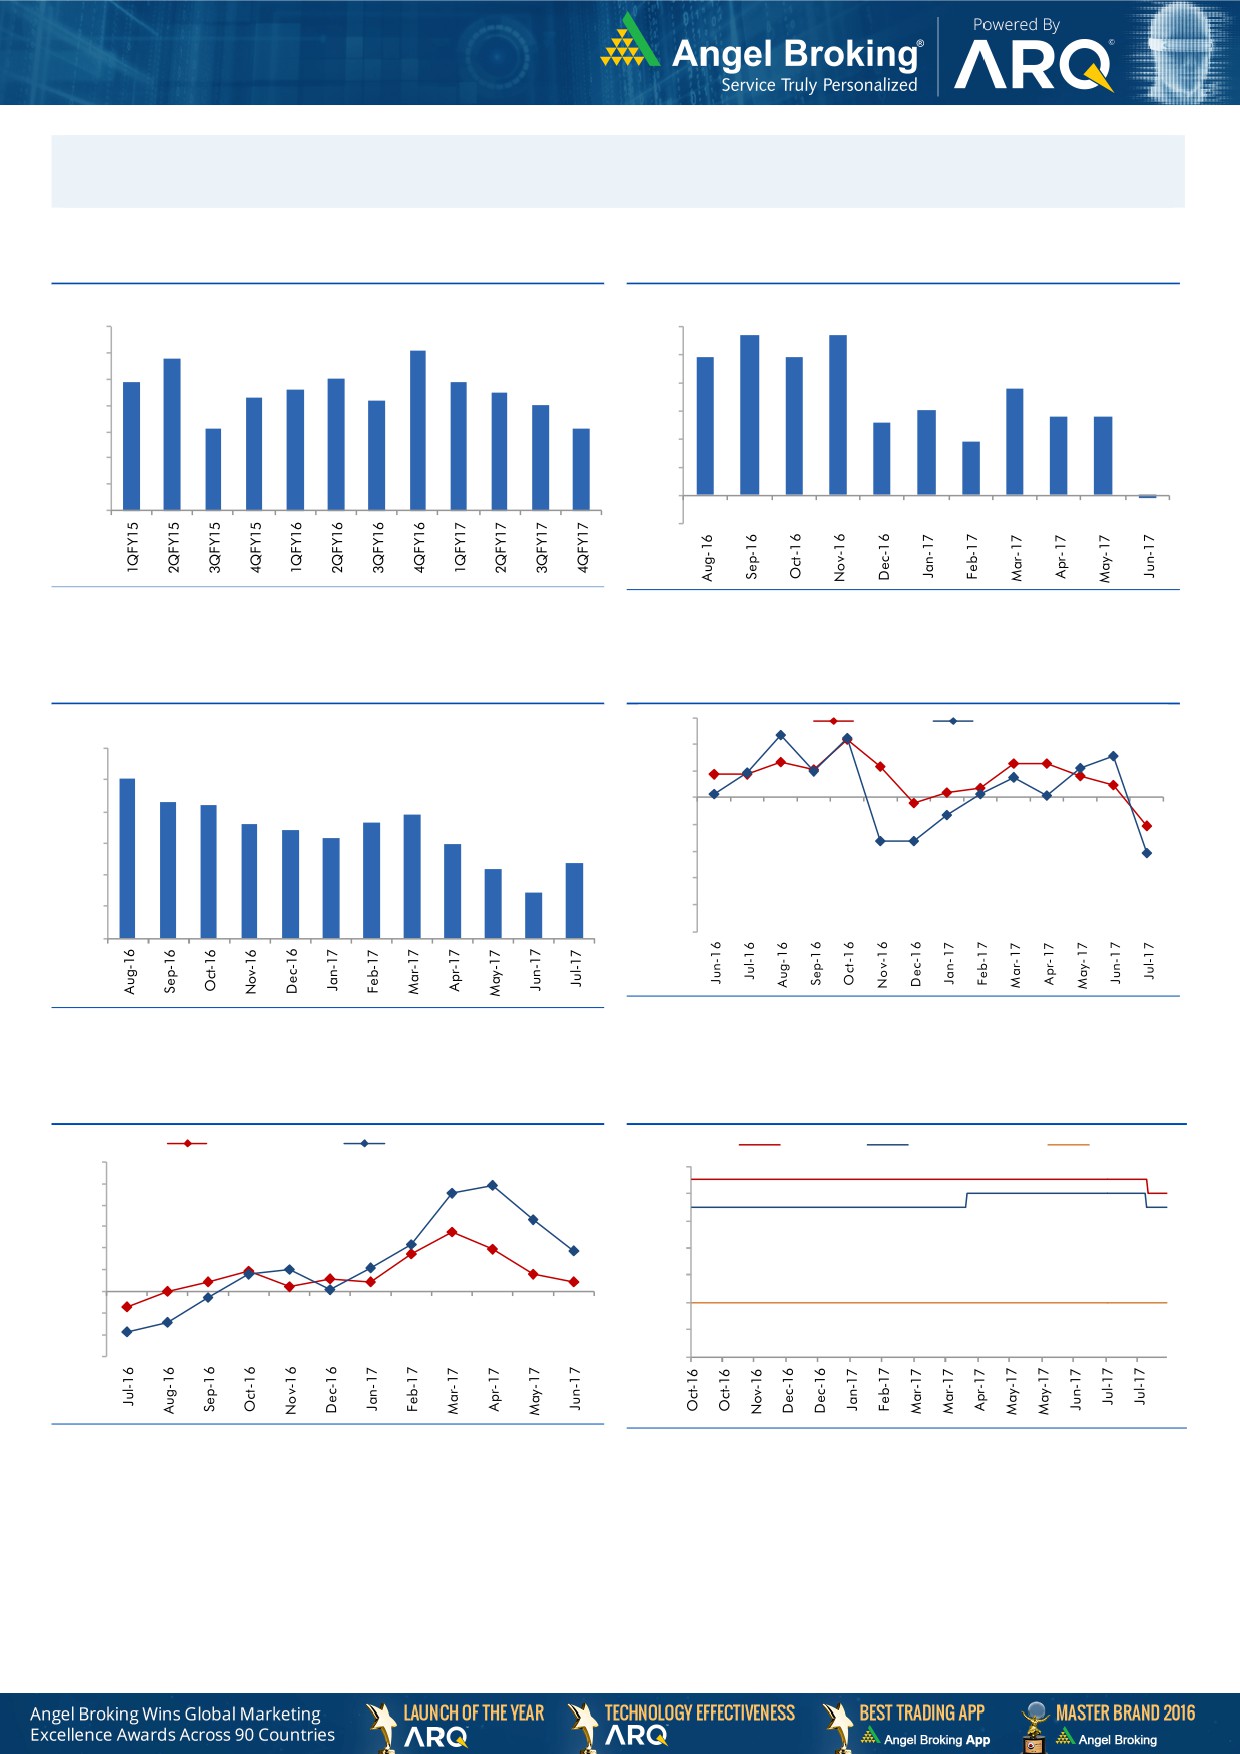
Macro watch
Exhibit 1: Quarterly GDP trends
Exhibit 2: IIP trends
(%)
(%)
5.7
5.7
10.0
6.0
9.1
8.8
4.9
4.9
9.0
5.0
7.9
8.0
7.9
7.6
7.5
3.8
8.0
7.3
7.2
4.0
7.0
3.0
2.8
2.8
7.0
2.6
6.1
6.1
3.0
1.9
6.0
2.0
5.0
1.0
4.0
-
3.0
(0.1)
(1.0)
Source: CSO, Angel Research
Source: MOSPI, Angel Research
Exhibit 3: Monthly CPI inflation trends
Exhibit 4: Manufacturing and services PMI
56.0
Mfg. PMI
Services PMI
(%)
54.0
6.0
5.1
52.0
5.0
4.3
4.2
3.9
50.0
3.6
3.7
4.0
3.4
3.2
3.0
48.0
3.0
2.4
2.2
46.0
2.0
1.5
44.0
1.0
42.0
40.0
-
Source: Market, Angel Research; Note: Level above 50 indicates expansion
Source: MOSPI, Angel Research
Exhibit 5: Exports and imports growth trends
Exhibit 6: Key policy rates
(%)
Exports yoy growth
Imports yoy growth
(%)
Repo rate
Reverse Repo rate
CRR
60.0
6.50
50.0
6.00
40.0
5.50
30.0
20.0
5.00
10.0
4.50
0 .0
4.00
(10.0)
3.50
(20.0)
(30.0)
3.00
Source: Bloomberg, Angel Research
Source: RBI, Angel Research
Market Outlook
August 18, 2017
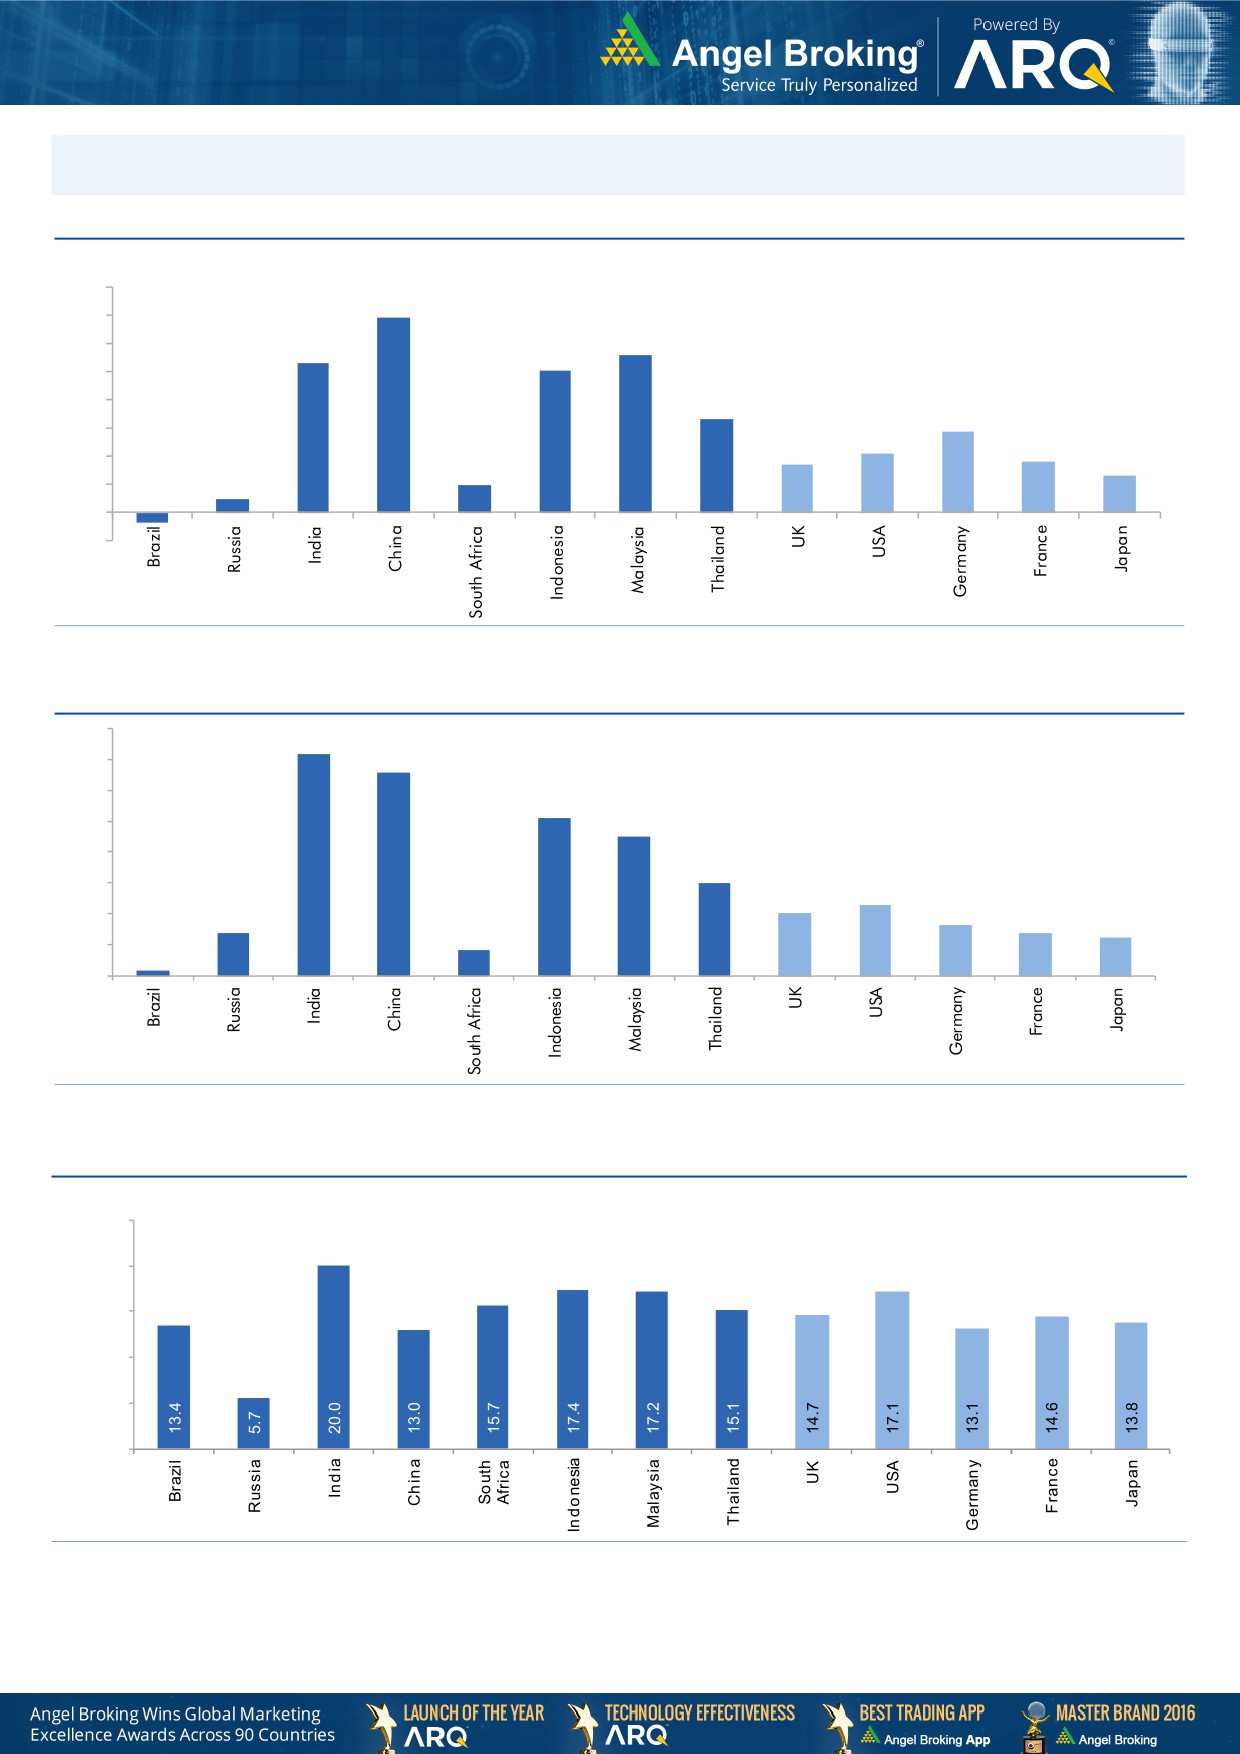
Global watch
Exhibit 1: Latest quarterly GDP Growth (%, yoy) across select developing and developed countries
(%)
8.0
6.9
7.0
5.6
6.0
5.3
5.0
1.0
5.0
4.0
3.3
2.9
3.0
2.1
0.5
1.7
1.8
2.0
1.3
1.0
-
(1.0)
(0.4)
Source: Bloomberg, Angel Research
Exhibit 2: 2016 GDP Growth projection by IMF (%, yoy) across select developing and developed countries
(%)
7.2
6.6
7.0
6.0
5.1
5.0
4.5
4.0
3.0
3.0
2.3
2.0
1.4
1.6
2.0
1.4
1.2
0.2
0.8
1.0
-
Source: IMF, Angel Research
Exhibit 3: One year forward P-E ratio across select developing and developed countries
(x)
25.0
20.0
15.0
10.0
5.0
-
Source: IMF, Angel Research
Market Outlook
August 18, 2017
Exhibit 4: Relative performance of indices across globe
Returns (%)
Country
Name of index
Closing price
1M
3M
1YR
Brazil
Bovespa
67,977
5.2
1.6
17.7
Russia
Micex
1,942
(0.2)
(1.2)
(0.8)
India
Nifty
9,904
(0.1)
4.0
15.3
China
Shanghai Composite
3,268
2.5
5.3
9.8
South Africa
Top 40
49,066
3.7
3.7
8.5
Mexico
Mexbol
50,994
(0.3)
5.9
6.0
Indonesia
LQ45
982
0.2
3.8
6.0
Malaysia
KLCI
1,776
1.2
(0.1)
6.2
Thailand
SET 50
998
(0.2)
1.3
1.1
USA
Dow Jones
21,751
1.8
5.0
18.6
UK
FTSE
7,388
(0.0)
(0.7)
7.7
Japan
Nikkei
19,703
(2.1)
(0.6)
17.5
Germany
DAX
12,203
(1.5)
(2.7)
15.6
France
CAC
5,147
(0.1)
(2.9)
17.3
Source: Bloomberg, Angel Research
Stock Watch
August 18, 2017
Company Name
Reco
CMP
Target
Mkt Cap
Sales ( Čcr )
OPM(%)
EPS (Č)
PER(x)
P/BV(x)
RoE(%)
EV/Sales(x)
(Č)
Price ( Č)
( Č cr )
FY17E FY18E
FY17E
FY18E
FY17E
FY18E
FY17E
FY18E
FY17E
FY18E
FY17E
FY18E
FY17E
FY18E
Agri / Agri Chemical
Rallis
Reduce
229
209
4,448
1,937
2,164
13.3
14.3
9.0
11.0
25.4
20.8
4.4
3.9
18.4
19.8
2.3
2.1
United Phosphorus
Neutral
854
-
43,396
15,176
17,604
18.5
18.5
37.4
44.6
22.8
19.2
4.5
3.7
21.4
21.2
3.0
2.5
Auto & Auto Ancillary
Ashok Leyland
Accumulate
105
116
30,816
20,019
22,789
11.1
11.7
4.3
5.5
24.5
19.3
4.8
4.3
19.4
22.0
1.5
1.3
Bajaj Auto
Neutral
2,821
-
81,622
25,093
27,891
19.5
19.2
143.9
162.5
19.6
17.4
5.5
4.7
30.3
29.4
3.0
2.6
Bharat Forge
Neutral
1,188
-
27,656
7,726
8,713
20.5
21.2
35.3
42.7
33.7
27.8
6.2
5.6
18.9
20.1
3.6
3.2
Eicher Motors
Neutral
30,848
-
83,974
16,583
20,447
17.5
18.0
598.0
745.2
51.6
41.4
17.6
13.4
41.2
38.3
4.9
3.9
Gabriel India
Neutral
176
-
2,529
1,544
1,715
9.0
9.3
5.4
6.3
32.6
27.9
6.2
5.5
18.9
19.5
1.6
1.4
Hero Motocorp
Neutral
3,997
-
79,816
28,120
30,753
15.2
15.6
169.1
189.2
23.6
21.1
8.1
6.8
30.8
28.2
2.7
2.4
Jamna Auto Industries Neutral
253
-
2,019
1,486
1,620
9.8
9.9
15.0
17.2
16.9
14.7
3.7
3.1
21.8
21.3
1.4
1.3
L G Balakrishnan & Bros Neutral
721
-
1,131
1,302
1,432
11.6
11.9
43.7
53.0
16.5
13.6
2.3
2.1
13.8
14.2
1.0
0.9
Mahindra and Mahindra Neutral
1,364
-
84,739
46,534
53,077
11.6
11.7
67.3
78.1
20.3
17.5
3.3
2.9
15.4
15.8
1.8
1.5
Maruti
Accumulate
7,607
8,495
229,786
67,822
83,717
15.2
15.0
243.0
291.5
31.3
26.1
7.2
5.8
22.9
22.4
3.1
2.4
Minda Industries
Neutral
792
-
6,845
2,728
3,042
9.0
9.1
68.2
86.2
11.6
9.2
2.6
2.1
23.8
24.3
2.6
2.3
Motherson Sumi
Neutral
324
-
68,218
45,896
53,687
7.8
8.3
13.0
16.1
24.9
20.1
8.0
6.4
34.7
35.4
1.6
1.3
Rane Brake Lining
Neutral
1,304
-
1,032
511
562
11.3
11.5
28.1
30.9
46.4
42.2
7.1
6.4
15.3
15.0
2.2
2.0
Setco Automotive
Neutral
37
-
499
741
837
13.0
13.0
15.2
17.0
2.5
2.2
0.4
0.4
15.8
16.3
1.1
1.0
Tata Motors
Neutral
385
-
111,177
300,209
338,549
8.9
8.4
42.7
54.3
9.0
7.1
1.5
1.2
15.6
17.2
0.5
0.4
TVS Motor
Neutral
581
-
27,603
13,390
15,948
6.9
7.1
12.8
16.5
45.5
35.1
11.3
9.0
26.3
27.2
2.1
1.7
Amara Raja Batteries
Buy
807
962
13,792
5,339
6,220
15.9
15.3
28.0
32.3
28.8
25.0
5.5
4.6
19.1
18.5
2.6
2.2
Exide Industries
Neutral
213
-
18,114
7,439
8,307
15.0
15.0
8.1
9.3
26.3
22.9
3.7
3.3
14.3
16.7
2.1
1.8
Apollo Tyres
Neutral
269
-
13,705
12,877
14,504
14.3
13.9
21.4
23.0
12.6
11.7
2.0
1.7
16.4
15.2
1.2
1.1
Ceat
Neutral
1,731
-
7,002
7,524
8,624
13.0
12.7
131.1
144.3
13.2
12.0
2.4
2.1
19.8
18.6
1.0
0.9
JK Tyres
Neutral
154
-
3,497
7,455
8,056
15.0
15.0
21.8
24.5
7.1
6.3
1.5
1.2
22.8
21.3
0.6
0.5
Swaraj Engines
Neutral
1,940
-
2,409
660
810
15.2
16.4
54.5
72.8
35.6
26.7
11.1
10.1
31.5
39.2
3.5
2.8
Subros
Neutral
227
-
1,359
1,488
1,681
11.7
11.9
6.4
7.2
35.4
31.6
3.7
3.4
10.8
11.4
1.1
1.0
Indag Rubber
Neutral
182
-
477
286
326
19.8
16.8
11.7
13.3
15.5
13.6
2.6
2.5
17.8
17.1
1.3
1.2
Capital Goods
ACE
Neutral
64
-
637
709
814
4.1
4.6
1.4
2.1
46.0
30.6
1.9
1.8
4.4
6.0
1.1
0.9
BEML
Neutral
1,860
-
7,745
3,451
4,055
6.3
9.2
31.4
57.9
59.2
32.1
3.6
3.2
6.3
10.9
2.4
2.0
Bharat Electronics
Neutral
183
-
40,909
8,137
9,169
16.8
17.2
58.7
62.5
3.1
2.9
0.5
0.4
44.6
46.3
4.0
3.6
Stock Watch
August 18, 2017
Company Name
Reco
CMP
Target
Mkt Cap
Sales ( Čcr )
OPM(%)
EPS (Č)
PER(x)
P/BV(x)
RoE(%)
EV/Sales(x)
(Č)
Price ( Č)
( Č cr )
FY17E
FY18E
FY17E
FY18E
FY17E
FY18E
FY17E
FY18E
FY17E
FY18E
FY17E
FY18E
FY17E
FY18E
Capital Goods
Voltas
Neutral
543
-
17,960
6,511
7,514
7.9
8.7
12.9
16.3
42.1
33.3
7.6
6.6
16.7
18.5
2.5
2.1
BGR Energy
Neutral
134
-
966
16,567
33,848
6.0
5.6
7.8
5.9
17.2
22.7
1.0
1.0
4.7
4.2
0.2
0.1
BHEL
Neutral
129
-
31,635
28,797
34,742
-
2.8
2.3
6.9
56.2
18.7
1.0
0.9
1.3
4.8
0.8
0.5
Blue Star
Neutral
738
-
7,067
4,283
5,077
5.9
7.3
14.9
22.1
49.6
33.4
9.6
8.1
20.4
26.4
1.7
1.4
CG Power and Industrial
Neutral
80
-
5,033
5,777
6,120
5.9
7.0
3.3
4.5
24.3
17.8
1.1
1.0
4.4
5.9
0.8
0.7
Solutions
Greaves Cotton
Neutral
150
-
3,664
1,755
1,881
16.8
16.9
7.8
8.5
19.2
17.7
3.9
3.6
20.6
20.9
1.8
1.6
Inox Wind
Neutral
107
-
2,381
5,605
6,267
15.7
16.4
24.8
30.0
4.3
3.6
1.2
0.9
25.9
24.4
0.5
0.4
KEC International
Neutral
302
-
7,767
9,294
10,186
7.9
8.1
9.9
11.9
30.5
25.4
4.5
3.9
15.6
16.3
1.1
1.0
KEI Industries
Buy
210
258
1,636
2,633
3,001
10.4
10.0
12.7
13.0
16.5
16.2
3.5
2.9
21.4
18.2
0.8
0.7
Thermax
Neutral
879
-
10,479
5,421
5,940
7.3
7.3
25.7
30.2
34.2
29.1
4.1
3.8
12.2
13.1
1.8
1.7
VATech Wabag
Accumulate
628
681
3,430
3,136
3,845
8.9
9.1
26.0
35.9
24.2
17.5
3.0
2.6
13.4
15.9
1.0
0.8
Cement
ACC
Neutral
1,777
-
33,364
11,225
13,172
13.2
16.9
44.5
75.5
39.9
23.5
3.8
3.5
11.2
14.2
3.0
2.5
Ambuja Cements
Neutral
270
-
53,642
9,350
10,979
18.2
22.5
5.8
9.5
46.6
28.4
3.9
3.5
10.2
12.5
5.7
4.9
India Cements
Neutral
185
-
5,692
4,364
4,997
18.5
19.2
7.9
11.3
23.4
16.4
1.7
1.6
8.0
8.5
2.1
1.8
JK Cement
Neutral
1,032
-
7,218
4,398
5,173
15.5
17.5
31.2
55.5
33.1
18.6
4.0
3.4
12.0
15.5
2.2
1.8
J K Lakshmi Cement
Neutral
419
-
4,929
2,913
3,412
14.5
19.5
7.5
22.5
55.9
18.6
3.4
2.9
12.5
18.0
2.3
1.9
Orient Cement
Neutral
155
-
3,167
2,114
2,558
18.5
20.5
8.1
11.3
19.1
13.7
2.8
2.4
9.0
14.0
2.1
1.7
UltraTech Cement
Neutral
3,937
-
108,069
25,768
30,385
21.0
23.5
111.0
160.0
35.5
24.6
4.5
4.0
13.5
15.8
4.3
3.6
Construction
ITNL
Neutral
80
-
2,623
8,946
10,017
31.0
31.6
8.1
9.1
9.9
8.8
0.4
0.4
4.2
5.0
3.6
3.4
KNR Constructions
Neutral
220
-
3,095
1,385
1,673
14.7
14.0
41.2
48.5
5.3
4.5
1.0
0.9
14.9
15.2
2.3
1.9
Larsen & Toubro
Buy
1,133
1,700
158,660
111,017
124,908
11.0
11.0
61.1
66.7
18.6
17.0
2.2
2.1
13.1
12.9
2.5
2.3
Gujarat Pipavav Port
Neutral
138
-
6,684
705
788
52.2
51.7
5.0
5.6
27.7
24.7
2.7
2.5
11.2
11.2
9.1
7.7
Nagarjuna Const.
Neutral
88
-
4,876
8,842
9,775
9.1
8.8
5.3
6.4
16.6
13.7
1.3
1.2
8.2
9.1
0.7
0.6
PNC Infratech
Neutral
140
-
3,603
2,350
2,904
13.1
13.2
9.0
8.8
15.6
16.0
0.6
0.5
15.9
13.9
1.7
1.3
Simplex Infra
Neutral
485
-
2,398
6,829
7,954
10.5
10.5
31.4
37.4
15.4
13.0
1.6
1.5
9.9
13.4
0.8
0.7
Power Mech Projects
Neutral
550
-
809
1,801
2,219
12.7
14.6
72.1
113.9
7.6
4.8
1.4
1.2
16.8
11.9
0.5
0.3
Sadbhav Engineering
Accumulate
271
298
4,648
3,598
4,140
10.3
10.6
9.0
11.9
30.1
22.8
3.2
2.8
9.9
11.9
1.6
1.3
NBCC
Neutral
207
-
18,657
7,428
9,549
7.9
8.6
8.2
11.0
25.3
18.9
1.3
1.0
28.2
28.7
2.2
1.7
MEP Infra
Neutral
117
-
1,899
1,877
1,943
30.6
29.8
3.0
4.2
38.9
27.8
18.8
12.7
0.6
0.6
2.4
2.2
Stock Watch
August 18, 2017
Company Name
Reco
CMP
Target
Mkt Cap
Sales ( Čcr )
OPM(%)
EPS (Č)
PER(x)
P/BV(x)
RoE(%)
EV/Sales(x)
(Č)
Price ( Č)
( Č cr )
FY17E
FY18E
FY17E
FY18E
FY17E
FY18E
FY17E
FY18E
FY17E
FY18E
FY17E
FY18E
FY17E
FY18E
Construction
SIPL
Neutral
102
-
3,596
1,036
1,252
65.5
66.2
(8.4)
(5.6)
3.8
4.4
(22.8)
(15.9)
11.7
9.7
Engineers India
Neutral
152
-
10,233
1,725
1,935
16.0
19.1
11.4
13.9
13.3
10.9
1.8
1.8
13.4
15.3
4.9
4.3
Financials
Axis Bank
Buy
497
580
119,094
46,932
53,575
3.5
3.4
32.4
44.6
15.4
11.1
2.0
1.7
13.6
16.5
-
-
Bank of Baroda
Neutral
148
-
34,182
19,980
23,178
1.8
1.8
11.5
17.3
12.9
8.6
1.5
1.2
8.3
10.1
-
-
Canara Bank
Neutral
336
-
20,069
15,225
16,836
1.8
1.8
14.5
28.0
23.2
12.0
1.6
1.3
5.8
8.5
-
-
Can Fin Homes
Neutral
2,960
-
7,879
420
526
3.5
3.5
86.5
107.8
34.2
27.5
7.4
6.0
23.6
24.1
-
-
Cholamandalam Inv. &
Accumulate
1,156
1,230
18,067
2,012
2,317
6.3
6.3
42.7
53.6
27.1
21.6
4.3
3.7
16.9
18.3
-
-
Fin. Co.
Dewan Housing Finance Buy
448
550
14,061
2,225
2,688
2.9
2.9
29.7
34.6
15.1
13.0
2.4
1.6
16.1
14.8
-
-
Equitas Holdings
Buy
161
235
5,438
939
1,281
11.7
11.5
5.8
8.2
27.7
19.6
2.4
2.1
10.9
11.5
-
-
Federal Bank
Buy
110
140
21,400
8,259
8,995
3.0
3.0
4.3
5.6
25.6
19.7
2.2
2.0
8.5
10.1
-
-
HDFC
Neutral
1,758
-
280,055
11,475
13,450
3.4
3.4
45.3
52.5
38.8
33.5
7.5
6.6
20.2
20.5
-
-
HDFC Bank
Neutral
1,767
-
455,066
46,097
55,433
4.5
4.5
58.4
68.0
30.3
26.0
5.3
4.4
18.8
18.6
-
-
ICICI Bank
Accumulate
294
335
188,388
42,800
44,686
3.1
3.3
18.0
21.9
16.3
13.4
2.2
2.1
11.1
12.3
-
-
Karur Vysya Bank
Accumulate
145
160
8,753
5,640
6,030
3.3
3.2
8.9
10.0
16.3
14.5
1.7
1.6
11.2
11.4
-
-
Lakshmi Vilas Bank
Neutral
178
-
3,407
3,339
3,799
2.7
2.8
11.0
14.0
16.2
12.7
1.7
1.5
11.2
12.7
-
-
LIC Housing Finance
Neutral
661
-
33,378
3,712
4,293
2.6
2.5
39.0
46.0
17.0
14.4
3.2
2.7
19.9
20.1
-
-
Punjab Natl.Bank
Neutral
147
-
31,185
23,532
23,595
2.3
2.4
6.8
12.6
21.6
11.6
3.3
2.4
3.3
6.5
-
-
RBL Bank
Neutral
517
-
19,608
1,783
2,309
2.6
2.6
12.7
16.4
40.7
31.5
4.4
4.0
12.8
13.3
-
-
Repco Home Finance
Buy
682
825
4,266
388
457
4.5
4.2
30.0
38.0
22.7
17.9
3.8
3.2
18.0
19.2
-
-
South Ind.Bank
Neutral
28
-
5,025
6,435
7,578
2.5
2.5
2.7
3.1
10.3
9.0
1.3
1.1
10.1
11.2
-
-
St Bk of India
Buy
281
335
242,345
88,650
98,335
2.6
2.6
13.5
18.8
20.8
14.9
2.0
1.7
7.0
8.5
-
-
Union Bank
Neutral
133
-
9,170
13,450
14,925
2.3
2.3
25.5
34.5
5.2
3.9
0.8
0.7
7.5
10.2
-
-
Yes Bank
Neutral
1,739
-
79,589
8,978
11,281
3.3
3.4
74.0
90.0
23.5
19.3
4.5
3.8
17.0
17.2
-
-
FMCG
Akzo Nobel India
Neutral
1,786
-
8,564
2,955
3,309
13.3
13.7
57.2
69.3
31.2
25.8
10.2
8.6
32.7
33.3
2.7
2.4
Asian Paints
Neutral
1,134
-
108,735
17,128
18,978
16.8
16.4
19.1
20.7
59.4
54.8
20.7
19.5
34.8
35.5
6.3
5.7
Britannia
Neutral
4,246
-
50,975
9,594
11,011
14.6
14.9
80.3
94.0
52.9
45.2
21.7
16.8
41.2
-
5.2
4.5
Colgate
Neutral
1,059
-
28,794
4,605
5,149
23.4
23.4
23.8
26.9
44.5
39.4
24.6
19.3
64.8
66.8
6.2
5.5
Dabur India
Neutral
308
-
54,272
8,315
9,405
19.8
20.7
8.1
9.2
38.0
33.5
10.6
8.8
31.6
31.0
6.2
5.4
GlaxoSmith Con*
Neutral
5,293
-
22,258
4,350
4,823
21.2
21.4
179.2
196.5
29.5
26.9
7.8
6.6
27.1
26.8
4.5
4.0
Stock Watch
August 18, 2017
Company Name
Reco
CMP
Target
Mkt Cap
Sales ( Čcr )
OPM(%)
EPS (Č)
PER(x)
P/BV(x)
RoE(%)
EV/Sales(x)
(Č)
Price ( Č)
( Č cr )
FY17E FY18E
FY17E
FY18E
FY17E
FY18E
FY17E
FY18E
FY17E
FY18E
FY17E
FY18E
FY17E
FY18E
FMCG
Godrej Consumer
Neutral
920
-
62,699
10,235
11,428
18.4
18.6
41.1
44.2
22.4
20.8
5.0
4.2
24.9
24.8
6.2
5.5
HUL
Neutral
1,175
-
254,249
35,252
38,495
17.8
17.8
20.7
22.4
56.9
52.5
54.4
46.6
95.6
88.9
7.1
6.4
ITC
Neutral
279
-
340,177
40,059
44,439
38.3
39.2
9.0
10.1
31.1
27.6
8.7
7.6
27.8
27.5
8.0
7.2
Marico
Neutral
319
-
41,205
6,430
7,349
18.8
19.5
6.4
7.7
49.9
41.5
15.1
12.7
33.2
32.5
6.2
5.4
Nestle*
Neutral
6,675
-
64,357
10,073
11,807
20.7
21.5
124.8
154.2
53.5
43.3
22.0
19.8
34.8
36.7
6.2
5.3
Tata Global
Neutral
191
-
12,029
8,675
9,088
9.8
9.8
7.4
8.2
25.8
23.2
2.0
1.9
7.9
8.1
1.3
1.2
Procter & Gamble
Neutral
8,210
-
26,650
2,939
3,342
23.2
23.0
146.2
163.7
56.2
50.2
14.2
11.8
25.3
23.5
8.6
7.5
Hygiene
IT
HCL Tech^
Buy
868
1,014
123,827
46,723
52,342
22.1
20.9
60.0
62.8
14.5
13.8
3.7
3.1
25.3
22.4
2.4
2.0
Infosys
Buy
1,021
1,179
234,553
68,484
73,963
26.0
26.0
63.0
64.0
16.2
16.0
3.4
3.1
20.8
19.7
3.1
2.7
TCS
Accumulate
2,480
2,651
488,696
117,966
127,403
27.5
27.6
134.3
144.5
18.5
17.2
5.5
5.1
29.8
29.7
3.8
3.5
Tech Mahindra
Buy
424
533
41,409
29,141
31,051
14.4
15.0
32.3
35.6
13.1
11.9
2.3
2.0
17.1
17.0
1.3
1.1
Wipro
Neutral
289
-
140,542
55,421
58,536
20.3
20.3
35.1
36.5
8.2
7.9
1.4
1.2
19.2
14.6
2.0
1.7
Media
D B Corp
Neutral
371
-
6,825
2,297
2,590
27.4
28.2
21.0
23.4
17.7
15.9
4.1
3.6
23.7
23.1
2.8
2.4
HT Media
Neutral
87
-
2,025
2,693
2,991
12.6
12.9
7.9
9.0
11.0
9.7
0.9
0.9
7.8
8.3
0.3
0.2
Jagran Prakashan
Buy
176
225
5,763
2,283
2,555
28.0
28.0
10.6
12.3
16.6
14.4
3.6
3.1
21.4
21.4
2.5
2.2
Sun TV Network
Neutral
752
-
29,617
2,850
3,265
70.1
71.0
26.2
30.4
28.7
24.7
7.3
6.5
24.3
25.6
10.0
8.6
Hindustan Media
Neutral
270
-
1,982
1,016
1,138
24.3
25.2
27.3
30.1
9.9
9.0
1.9
1.7
16.2
15.8
1.3
1.1
Ventures
TV Today Network
Buy
245
344
1,462
608
667
21.5
22.3
15.7
19.2
15.6
12.7
2.4
2.0
16.1
16.0
2.0
1.7
Music Broadcast Limited Buy
375
434
2,142
271
317
91.0
109.0
6.0
10.0
62.6
37.5
3.9
3.5
6.5
9.3
7.5
6.2
Metals & Mining
Coal India
Neutral
247
-
153,354
84,638
94,297
21.4
22.3
24.5
27.1
10.1
9.1
4.2
4.0
42.6
46.0
1.3
1.2
Hind. Zinc
Neutral
295
-
124,436
14,252
18,465
55.9
48.3
15.8
21.5
18.6
13.7
3.0
2.7
17.0
20.7
8.7
6.7
Hindalco
Neutral
230
-
51,656
107,899
112,095
7.4
8.2
9.2
13.0
25.0
17.7
1.2
1.1
4.8
6.6
1.0
0.9
JSW Steel
Neutral
235
-
56,684
53,201
58,779
16.1
16.2
130.6
153.7
1.8
1.5
0.2
0.2
14.0
14.4
1.8
1.6
NMDC
Neutral
123
-
39,011
6,643
7,284
44.4
47.7
7.1
7.7
17.4
16.0
1.5
1.5
8.8
9.2
3.6
3.3
SAIL
Neutral
59
-
24,368
47,528
53,738
(0.7)
2.1
(1.9)
2.6
22.7
0.6
0.6
(1.6)
3.9
1.4
1.2
Vedanta
Neutral
305
-
113,300
71,744
81,944
19.2
21.7
13.4
20.1
22.8
15.2
1.9
1.8
8.4
11.3
2.0
1.6
Tata Steel
Neutral
626
-
60,784
121,374
121,856
7.2
8.4
18.6
34.3
33.7
18.3
2.1
1.9
6.1
10.1
1.1
1.1
Oil & Gas
GAIL
Neutral
375
-
63,415
56,220
65,198
9.3
10.1
27.1
33.3
13.8
11.3
1.3
1.2
9.3
10.7
1.3
1.1
ONGC
Neutral
161
-
205,974
137,222
152,563
15.0
21.8
19.5
24.1
8.2
6.7
0.7
0.7
8.5
10.1
1.8
1.6
Stock Watch
August 18, 2017
Company Name
Reco
CMP
Target
Mkt Cap
Sales ( Čcr )
OPM(%)
EPS (Č)
PER(x)
P/BV(x)
RoE(%)
EV/Sales(x)
(Č)
Price ( Č)
( Č cr )
FY17E FY18E
FY17E
FY18E
FY17E
FY18E
FY17E
FY18E
FY17E
FY18E
FY17E
FY18E
FY17E
FY18E
Oil & Gas
Indian Oil Corp
Neutral
426
-
207,007
373,359
428,656
5.9
5.5
54.0
59.3
7.9
7.2
1.2
1.1
16.0
15.6
0.7
0.6
Reliance Industries
Neutral
1,566
-
509,264
301,963
358,039
12.1
12.6
87.7
101.7
17.9
15.4
1.8
1.7
10.7
11.3
2.2
1.8
Pharmaceuticals
Alembic Pharma
Buy
514
600
9,686
3,101
3,966
19.7
20.5
21.4
25.5
24.0
20.2
5.1
4.2
23.0
22.8
3.1
2.3
Alkem Laboratories Ltd
Buy
1,819
2,161
21,743
5,853
6,901
17.1
18.4
74.6
85.0
24.4
21.4
5.1
4.3
21.1
20.2
3.7
3.1
Aurobindo Pharma
Buy
704
823
41,217
14,845
17,086
21.5
22.1
39.4
44.7
17.9
15.7
4.4
3.5
27.6
24.7
2.9
2.5
Aventis*
Reduce
4,090
3,845
9,420
2,206
2,508
16.6
16.8
128.9
139.9
31.7
29.2
5.4
4.2
21.6
23.5
4.0
3.4
Cadila Healthcare
Reduce
482
426
49,324
9,220
11,584
18.4
20.3
14.5
18.7
33.2
25.8
7.1
5.7
23.5
24.6
5.7
4.3
Cipla
Sell
573
458
46,136
14,281
16,619
15.4
16.2
12.5
19.7
45.9
29.1
3.7
3.3
8.4
12.0
3.4
2.9
Dr Reddy's
Accumulate
2,010
2,219
33,317
14,081
15,937
16.1
18.6
72.6
105.9
27.7
19.0
2.7
2.5
9.6
13.6
2.6
2.3
Dishman Pharma
Sell
143
1,718
1,890
22.7
22.8
9.5
11.3
10.1
10.9
3.3
2.9
GSK Pharma*
Neutral
2,385
-
20,202
2,927
3,290
11.8
16.2
34.4
49.6
69.3
48.1
10.1
10.5
13.9
21.3
6.7
6.0
Indoco Remedies
Sell
196
153
1,804
1,067
1,154
12.1
14.9
8.4
11.3
23.3
17.3
2.8
2.5
12.6
15.0
1.9
1.8
Ipca labs
Buy
417
620
5,265
3,211
3,593
13.9
14.5
15.4
19.4
27.1
21.5
2.1
2.0
8.2
9.5
1.8
1.5
Lupin
Buy
954
1,467
43,101
17,120
18,657
24.1
24.1
56.9
61.1
16.8
15.6
3.2
2.7
20.7
18.6
2.8
2.2
Natco Pharma
Buy
773
1,060
13,467
2,065
1,988
33.1
33.7
27.9
25.7
27.7
30.1
8.1
6.9
29.2
22.9
6.6
6.6
Sun Pharma
Accumulate
489
545
117,227
30,264
32,899
29.0
26.9
32.7
31.6
14.9
15.5
3.2
2.7
22.2
18.7
3.6
3.2
Power
Tata Power
Neutral
81
-
22,003
36,916
39,557
17.4
27.1
5.1
6.3
16.0
12.9
1.4
1.3
9.0
10.3
1.6
1.4
NTPC
Neutral
177
-
145,821
86,605
95,545
17.5
20.8
11.8
13.4
15.0
13.2
1.5
1.4
10.5
11.1
3.0
3.0
Power Grid
Neutral
219
-
114,807
25,315
29,193
88.2
88.7
14.2
17.2
15.5
12.8
2.4
2.1
15.2
16.1
9.2
8.2
Real Estate
Prestige Estate
Neutral
264
-
9,881
4,707
5,105
25.2
26.0
10.3
13.0
25.6
20.3
2.1
1.9
10.3
10.2
3.3
2.9
MLIFE
Buy
414
522
2,123
1,152
1,300
22.7
24.6
29.9
35.8
13.8
11.6
1.0
1.0
7.6
8.6
2.6
2.2
Telecom
Bharti Airtel
Neutral
417
-
166,512
105,086
114,808
34.5
34.7
12.2
16.4
34.1
25.4
2.3
2.2
6.8
8.4
2.5
2.2
Idea Cellular
Neutral
89
-
32,243
40,133
43,731
37.2
37.1
6.4
6.5
14.0
13.8
1.2
1.1
8.2
7.6
1.8
1.6
zOthers
Abbott India
Neutral
4,311
-
9,160
3,153
3,583
14.1
14.4
152.2
182.7
28.3
23.6
139.1
118.8
25.6
26.1
2.6
2.2
Asian Granito
Buy
411
480
1,238
1,066
1,169
11.6
12.5
13.0
16.0
31.7
25.8
3.1
2.8
9.5
10.7
1.5
1.3
Bajaj Electricals
Buy
328
395
3,331
4,801
5,351
5.7
6.2
10.4
13.7
31.5
24.0
3.9
3.5
12.4
14.5
0.7
0.6
Banco Products (India)
Neutral
214
-
1,527
1,353
1,471
12.3
12.4
14.5
16.3
14.7
13.1
20.3
18.3
14.5
14.6
1.1
114.7
Coffee Day Enterprises
Neutral
243
-
4,999
2,964
3,260
20.5
21.2
4.7
8.0
-
30.3
2.8
2.6
5.5
8.5
2.1
1.9
Ltd
Competent Automobiles Neutral
211
-
135
1,137
1,256
3.1
2.7
28.0
23.6
7.6
9.0
40.6
36.7
14.3
11.5
0.1
0.1
Stock Watch
August 18, 2017
Company Name
Reco
CMP
Target
Mkt Cap
Sales ( Čcr )
OPM(%)
EPS (Č)
PER(x)
P/BV(x)
RoE(%)
EV/Sales(x)
(Č)
Price ( Č)
( Č cr )
FY17E
FY18E
FY17E
FY18E
FY17E
FY18E
FY17E
FY18E
FY17E
FY18E
FY17E
FY18E
FY17E
FY18E
zOthers
Elecon Engineering
Neutral
49
-
550
1,482
1,660
13.7
14.5
3.9
5.8
12.6
8.5
3.0
2.7
7.8
10.9
0.7
0.6
Finolex Cables
Neutral
529
-
8,097
2,883
3,115
12.0
12.1
14.2
18.6
37.3
28.5
19.8
17.3
15.8
14.6
2.5
2.3
Garware Wall Ropes
Neutral
899
-
1,967
863
928
15.1
15.2
36.4
39.4
24.7
22.8
4.5
3.8
17.5
15.9
2.2
2.0
Goodyear India*
Neutral
830
-
1,914
1,598
1,704
10.4
10.2
49.4
52.6
16.8
15.8
77.6
68.0
18.2
17.0
0.9
125.1
Hitachi
Neutral
2,046
-
5,563
2,081
2,433
8.8
8.9
33.4
39.9
61.3
51.3
49.4
41.2
22.1
21.4
2.7
2.3
HSIL
Neutral
351
-
2,539
2,384
2,515
15.8
16.3
15.3
19.4
23.0
18.1
22.8
19.6
7.8
9.3
1.2
1.1
Interglobe Aviation
Neutral
1,312
-
47,467
21,122
26,005
14.5
27.6
110.7
132.1
11.9
9.9
70.9
50.7
168.5
201.1
2.2
1.8
Jyothy Laboratories
Neutral
376
-
6,835
1,440
2,052
11.5
13.0
8.5
10.0
44.3
37.6
10.7
9.9
18.6
19.3
5.0
3.5
Kirloskar Engines India
Neutral
392
-
5,669
2,554
2,800
9.9
10.0
10.5
12.1
37.3
32.4
15.6
14.7
10.7
11.7
1.9
1.7
Ltd
Linc Pen & Plastics
Neutral
251
-
371
382
420
9.3
9.5
13.5
15.7
18.6
16.0
3.2
2.8
17.1
17.3
1.0
0.9
M M Forgings
Neutral
612
-
739
546
608
20.4
20.7
41.3
48.7
14.8
12.6
83.9
74.2
16.6
17.0
1.2
1.1
Manpasand Bever.
Neutral
821
-
4,696
836
1,087
19.6
19.4
16.9
23.8
48.6
34.5
5.8
5.1
12.0
14.8
5.4
4.0
Mirza International
Neutral
159
-
1,913
963
1,069
17.2
18.0
6.1
7.5
26.0
21.2
4.0
3.4
15.0
15.7
2.2
2.0
MT Educare
Neutral
62
-
246
366
417
17.7
18.2
9.4
10.8
6.6
5.7
1.5
1.3
22.2
22.3
0.6
0.5
Narayana Hrudaya
Neutral
298
-
6,084
1,873
2,166
11.5
11.7
2.6
4.0
112.6
75.1
6.9
6.2
6.1
8.3
3.3
2.9
Navkar Corporation
Buy
192
265
2,732
347
371
43.2
37.3
6.7
6.0
28.7
32.0
2.0
1.8
6.2
10.6
9.0
8.4
Navneet Education
Neutral
158
-
3,680
1,062
1,147
24.0
24.0
6.1
6.6
25.9
23.8
5.3
4.7
20.6
19.8
3.5
3.3
Nilkamal
Neutral
1,665
-
2,485
1,995
2,165
10.7
10.4
69.8
80.6
23.9
20.7
95.2
82.7
16.6
16.5
1.2
1.1
Page Industries
Neutral
16,889
-
18,838
2,450
3,124
20.1
17.6
299.0
310.0
56.5
54.5
376.2
287.1
47.1
87.5
7.7
6.1
Parag Milk Foods
Neutral
236
-
1,983
1,919
2,231
9.3
9.6
9.5
12.9
25.0
18.2
3.9
3.2
15.5
17.5
1.2
1.0
Quick Heal
Neutral
187
-
1,314
408
495
27.3
27.0
7.7
8.8
24.2
21.3
2.2
2.3
9.3
10.6
2.4
2.0
Radico Khaitan
Neutral
169
-
2,244
1,667
1,824
13.0
13.2
6.7
8.2
25.4
20.6
2.3
2.1
9.0
10.2
1.7
1.6
Relaxo Footwears
Neutral
495
-
5,948
2,085
2,469
9.2
8.2
7.6
8.0
65.5
62.3
25.4
21.7
17.9
18.8
2.9
2.5
S H Kelkar & Co.
Neutral
257
-
3,710
1,036
1,160
15.1
15.0
6.1
7.2
42.0
35.7
4.5
4.1
10.7
11.5
3.5
3.0
Siyaram Silk Mills
Buy
2,042
2,500
1,915
1,574
1,769
12.5
12.7
97.1
113.1
21.0
18.1
3.2
2.8
15.4
15.5
1.4
1.3
Styrolution ABS India*
Neutral
870
-
1,530
1,440
1,537
9.2
9.0
40.6
42.6
21.4
20.4
54.7
49.8
12.3
11.6
1.0
0.9
Surya Roshni
Neutral
279
-
1,222
3,342
3,625
7.8
7.5
17.3
19.8
16.1
14.1
30.6
24.6
10.5
10.8
0.6
0.6
Team Lease Serv.
Neutral
1,440
-
2,462
3,229
4,001
1.5
1.8
22.8
32.8
63.2
43.9
6.8
5.9
10.7
13.4
0.7
0.5
The Byke Hospitality
Neutral
192
-
769
287
384
20.5
20.5
7.6
10.7
25.2
17.9
5.3
4.3
20.7
23.5
2.7
2.0
Stock Watch
August 18, 2017
Company Name
Reco
CMP
Target Mkt Cap
Sales ( Čcr )
OPM(%)
EPS (Č)
PER(x)
P/BV(x)
RoE(%)
EV/Sales(x)
(Č)
Price ( Č)
( Č cr )
FY17E FY18E FY17E FY18E FY17E FY18E FY17E FY18E FY17E FY18E FY17E FY18E FY17E FY18E
zOthers
Transport Corporation of
Neutral
286
-
2,187
2,671
2,911
8.5
8.8
13.9
15.7
20.6
18.3
2.8
2.5
13.7
13.8
0.9
0.9
India
TVS Srichakra
Neutral
3,341
-
2,558
2,304
2,614
13.7
13.8
231.1
266.6
14.5
12.5
375.4
295.6
33.9
29.3
1.1
1.0
UFO Moviez
Neutral
347
-
959
619
685
33.2
33.4
30.0
34.9
11.6
10.0
1.6
1.4
13.8
13.9
1.3
1.0
Visaka Industries
Neutral
505
-
803
1,051
1,138
10.3
10.4
21.0
23.1
24.1
21.8
64.8
60.7
9.0
9.2
1.0
1.0
VRL Logistics
Neutral
331
-
3,018
1,902
2,119
16.7
16.6
14.6
16.8
22.7
19.7
5.0
4.4
21.9
22.2
1.7
1.5
VIP Industries
Accumulate
195
218
2,762
1,270
1,450
10.4
10.4
5.6
6.5
34.9
30.1
7.2
6.3
20.7
21.1
2.2
1.9
Navin Fluorine
Accumulate
692
730
3,410
789
945
21.1
22.4
24.0
28.7
28.8
24.1
4.6
4.0
17.8
18.5
4.3
3.5
Source: Company, Angel Research; Note: *December year end; #September year end; &October year end; Price as on August 17, 2017
Market Outlook
August 18, 2017
Research Team Tel: 022 - 39357800
DISCLAIMER
Angel Broking Private Limited (hereinafter referred to as “Angel”) is a registered Member of National Stock Exchange of India
Limited,Bombay Stock Exchange Limited and Metropolitan Stock Exchange Limited. It is also registered as a Depository Participant with
CDSL and Portfolio Manager with SEBI. It also has registration with AMFI as a Mutual Fund Distributor. Angel Broking Private Limited is a
registered entity with SEBI for Research Analyst in terms of SEBI (Research Analyst) Regulations, 2014 vide registration number
INH000000164. Angel or its associates has not been debarred/ suspended by SEBI or any other regulatory authority for accessing
/dealing in securities Market. Angel or its associates/analyst has not received any compensation / managed or
co-managed public offering of securities of the company covered by Analyst during the past twelve months.
This document is solely for the personal information of the recipient, and must not be singularly used as the basis of any investment
decision. Nothing in this document should be construed as investment or financial advice. Each recipient of this document should make
such investigations as they deem necessary to arrive at an independent evaluation of an investment in the securities of the companies
referred to in this document (including the merits and risks involved), and should consult their own advisors to determine the merits and
risks of such an investment.
Reports based on technical and derivative analysis center on studying charts of a stock's price movement, outstanding positions and
trading volume, as opposed to focusing on a company's fundamentals and, as such, may not match with a report on a company's
fundamentals. Investors are advised to refer the Fundamental and Technical Research Reports available on our website to evaluate the
contrary view, if any.
The information in this document has been printed on the basis of publicly available information, internal data and other reliable
sources believed to be true, but we do not represent that it is accurate or complete and it should not be relied on as such, as this
document is for general guidance only. Angel Broking Pvt. Limited or any of its affiliates/ group companies shall not be in any way
responsible for any loss or damage that may arise to any person from any inadvertent error in the information contained in this report.
Angel Broking Pvt. Limited has not independently verified all the information contained within this document. Accordingly, we cannot
testify, nor make any representation or warranty, express or implied, to the accuracy, contents or data contained within this document.
While Angel Broking Pvt. Limited endeavors to update on a reasonable basis the information discussed in this material, there may be
regulatory, compliance, or other reasons that prevent us from doing so.
This document is being supplied to you solely for your information, and its contents, information or data may not be reproduced,
redistributed or passed on, directly or indirectly.
Neither Angel Broking Pvt. Limited, nor its directors, employees or affiliates shall be liable for any loss or damage that may arise from
or in connection with the use of this information.